“I am having a bad bad day
It is about time that I get my way
Steam rolling whatever I see, huh
Despicable me
I’m having a bad bad day
If you take it personal that’s okay
Watch this is so fun to see, huh
Despicable me”
lyrics: Despicable me
In the Despicable me movie, when Gru was upset, he became cruel and started steam rolling whatever he saw. Of course, in the real world, we can’t do whatever you want, so what would you do? For me, I would like to listen to music. Occasionally, I listened some uplifting music to cheer myself up, but most of the time, I would like to listen to sad music.
In a recently published study, researchers found people with major depressive disorder are more likely to prefer sad muisc. Even though graduate school hasn’t treated me very well, I am not depressed; however, I do agree with one of the setences in their article "The strong appeal of sad music to people with depression may be related to its calming effects rather than any desire to increase or maintain sad feelings".
I have always wanted to analyze my music preference, but did not find a good way to do that. Luckily, I found this amazing package spotifyr, and more luckily, Spotify have an amazing feature which allows users to pull track audio featuers including key,mode, and some very helpful psychological measures, such as valence, energy, and so on. Thank you, Spotify! I have become a heavy user of Spotify in recent years, so I collected enough songs to do data analysis. Now, let’s get it started!
To analyze your own music data, you have to set up a developer account with Spotify to access their API. Spotifyr package gave a nice introduction about the setup, you might want to follow their instructions.
library(tidyverse)
library(spotifyr)

Sys.setenv(SPOTIFY_CLIENT_ID = 'my client id')
Sys.setenv(SPOTIFY_CLIENT_SECRET = 'my client secret')
access_token <- get_spotify_access_token()
For now, I just want to have a quick look of my tracks’ valences in one of my favourite playlists. Because valence measures musical positiveness conveyed by a track, thus, the higher the value it is, the more positive it is (e.g., happy, cheerful), this attribute makes valence a perfect measure of my tracks’ sadness.
Extract Valences
# get my playlists
playlists <- get_my_playlists() %>% select(name,id)

# get track.id, track.name inside this playlist
track_info <- get_playlist_tracks(playlists[playlists$name=="douban",]$id) %>%   select(track.id,track.name,track.artists) %>%
  mutate(track.artist = map_chr(track.artists, function(x) x$name[1])) %>% select(-track.artists)

# extract track audio features
track_audio_features <- track_info['track.id'] %>% map(get_track_audio_features)
track_allinfo <- cbind(select(track_info,-track.id),select(track_audio_features$track.id,danceability:tempo))

# remove duplicated tracks
track_allinfo <- track_allinfo[!duplicated(track_allinfo$track.name),]
Plot Valences
# 10 tracks with the highest valences
high_valence <- track_allinfo %>% arrange(desc(valence)) %>% head(10) %>% mutate(hl = "high")
# 10 tracks with the lowest valences
low_valence <- track_allinfo %>% arrange(valence) %>% head(10) %>% mutate(hl = "low")
high_low <- rbind(high_valence,low_valence)

# use different colors to represent tracks with higher valences (>0.49) or lower valences
track_allinfo_pos <- track_allinfo %>% mutate(pos = valence >= 0.49)
# get the distribution of valences
histo_valence <- ggplot(track_allinfo_pos,aes(x=valence,fill=pos))+geom_histogram(color="black",alpha=0.5)+
  theme_bw()+xlab('Valence (musical positiveness conveyed by a track)')+
  ggtitle("Valence distribution")+
  scale_fill_brewer(palette = "Set2", limits = c("FALSE","TRUE"),guide=FALSE)

# find the most positive and sad tracks
high_low_plot <- ggplot(high_low, aes(x = valence, y = reorder(track.name,valence))) +
  geom_segment(aes(yend = track.name), xend = 0, colour = "grey50") +
  geom_point(size = 3, aes(colour = hl)) +
  scale_colour_brewer(palette = "Set2", limits = c("low","high"),guide=FALSE) +
  theme_bw() +
  theme(panel.grid.major.y = element_blank())+
  labs(x = "Valence",
       y = "Track name",
       title = "The most and least positive songs",
       caption = "Playlist: douban")+
  facet_grid(hl ~ ., scales = "free_y",space = "free_y")

cowplot::plot_grid(histo_valence,high_low_plot)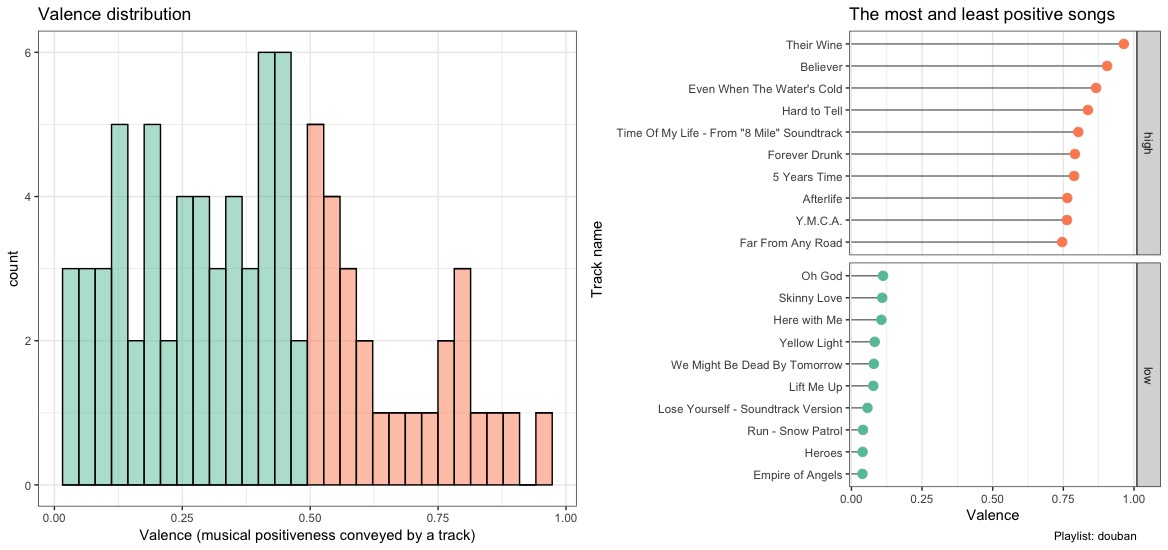
It seems I do prefer the sad songs, since there are more sad songs (valence < 0.5, in green color) in this playlist. Okay, before digging deeper into my music preferences, let me relax a little bit by listening to my saddest track: Empire of Angels.